Guide · General
Software Price Comparison: Real Costs Beyond List Prices
Software price comparison beyond list prices: starting costs by category, billing terms, hidden fees, and 2026 figures with named vendors and check dates.
By the Rankozo research desk · Updated November 10, 2026 · 13 min read
Businesses spent approximately $8,700 per employee on SaaS products in 2024, up from $7,900 in 2023, according to figures attributed to Vertice in a 2024 SaaS spending summary. That total is not visible in any single monthly price. A sound software price comparison therefore starts with the annualized, all-in cost for the same users, usage and period, then works back to the advertised rate.
Table of Contents
- Starting Prices by Software Category in 2026
- How to Put Every Price on the Same Annual Basis
- How Billing Terms Change the Real Price
- Hidden Costs That Lift the Total Cost of Ownership
- Discounts by Contract Size and Seat Minimums
- Idle Seats and Usage Fees That Inflate the Bill
- Which Price Structure Fits Your Buyer Type
- Confirm the Lowest Real Cost Before You Buy
Starting Prices by Software Category in 2026
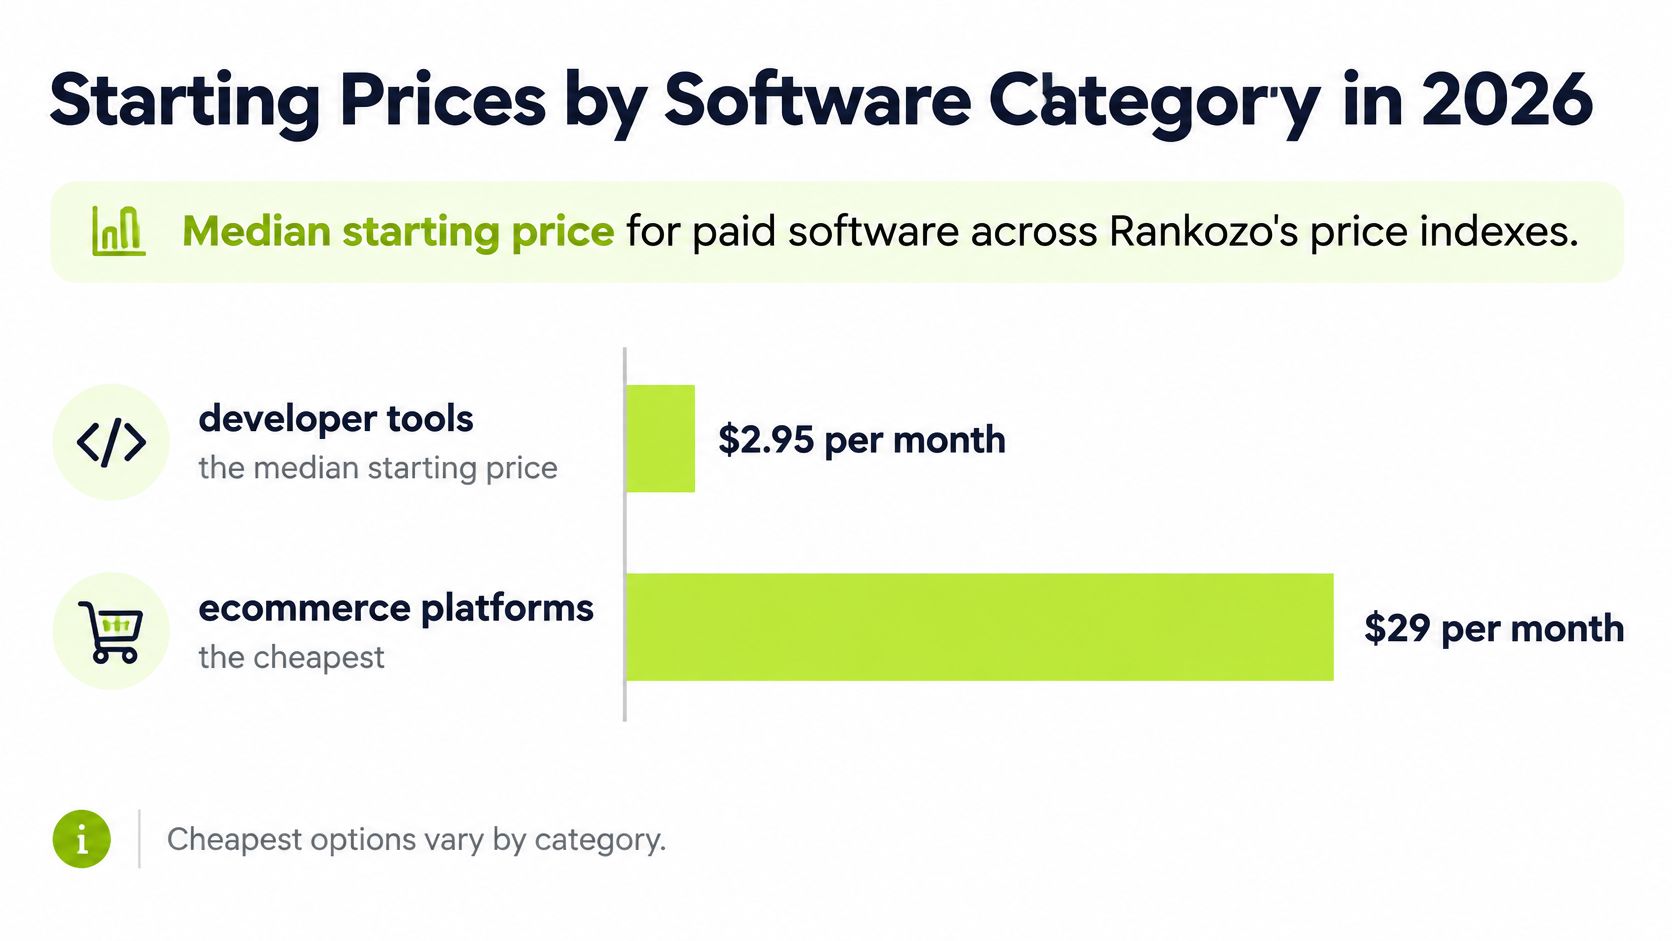
Across Rankozo's price indexes, the median starting price runs from $2.95 per month for developer tools to $29 per month for ecommerce platforms, while the cheapest paid tiers sit between $1 and $15 per month. Read that spread as a filter, not a quote. A plan priced far above its category median needs a feature, usage or service reason that survives an annualized cost check.
What the Floor Price Means
The cheapest paid tier is the lowest paid plan price quoted word for word from the vendor's US pricing page. It is a floor. It leaves out seat minimums, annual-billing conditions, add-ons and usage above the entry allowance, so it can rank the wrong product if the pricing unit is different. A $29 median in ecommerce and a $2.95 median in developer tools describe different markets and different buying motions, not a single cheap-to-expensive ladder.
Starting prices, free plans and cheapest paid tiers by category
| Category | Median starting price | Tools with a free plan | Cheapest paid tier |
|---|---|---|---|
| Ecommerce platforms | $29 per month | 44% of 9 tools | Big Cartel at $15 per month |
| Marketing and SEO | $19 per month | 58% of 19 tools | Brevo at $9 per month |
| AI tools | $12 per month | 71% of 17 tools | Midjourney at $8 per month |
| Finance and accounting | $9.04 per month | 42% of tools | PocketGuard at $6.25 per month, billed yearly |
| HR and work | $9 per month | 33% of 18 tools | Clockify at $3.99 per seat per month |
| Developer tools | $2.95 per month | 39% of tools | IONOS at $1 per month |
Each index covers every tool in the matching Rankozo rankings, and vendors that publish no price are listed without a starting price. Each median therefore covers only the priced tools in that category, which is why the denominator matters: 71% of 17 AI tools is a wider free-plan base than 44% of 9 ecommerce tools. The AI tools figures are in US dollars per month unless noted and were checked on November 4, 2026; the developer tools index was updated the same day.
Use the software and SaaS pricing index as a category sanity check before accepting a quote. If a proposal lands above the relevant median, the burden is on the contract: more seats, higher usage, a different unit or a billing term that changes the actual annual cost.
How to Put Every Price on the Same Annual Basis
A $10 per user plan and a $10 per account plan aren't the same deal, so the first job is to name the unit. Vendors price in different units, and Rankozo's tables are meant to compare like with like. Without that step, a software price comparison ranks labels rather than costs.
Five Steps to One Annual Figure
- Identify the pricing unit: Per user, per seat, per account, usage-based, or a flat tier with an allowance, exactly as the vendor page states it.
- Write the headline price in its quoted unit: A per-seat price stays per seat until the seat count is known.
- Multiply by units paid for: Users, seats or accounts that the contract charges for, including any minimum.
- Multiply by twelve: That gives the annual figure, or by the full billing term for a multi-year total.
- Add usage at expected volume: Overage and metered charges belong in the total at realistic volume, not at the lowest tier.
Pricing units and how to annualize each one
| Pricing unit | What the price covers | Annual cost check |
|---|---|---|
| Per user per month | One named person | Price times named users times 12 |
| Per seat per month | One purchased seat, which may be assigned or pooled | Price times purchased seats times 12, after checking the seat minimum |
| Per account per month | The whole account regardless of users | Price times 12, flat as the team grows |
| Usage-based | Metered units such as calls, contacts, minutes or stored items | Units per month times rate times 12, so the cost rises with volume and has no fixed total |
| Flat tier with allowance | A fixed package with a usage cap | Price times 12 plus overage at expected volume, with the overage rate checked before comparing |
Take a worked example at $29 per user per month. For one user, the annual cost is $348. For 10 users, it becomes $3,480 a year before any discount or minimum seat count. A per-account plan at the same headline rate would stay at $348 for the whole team, which shows why the unit matters more than the number.
The unit check is becoming harder, not simpler. A 2025 benchmark summary citing OpenView data reports that per-seat pricing fell from 44% of SaaS companies in 2023 to 38% in 2025, while usage-based pricing rose from 27% to 34% and hybrid models rose from 31% to 42% over the same period. Hybrid plans combine a fixed fee with metered consumption, so the annual total can't be read from the entry price alone.
Practical rule: Compare only figures that share the same unit, team size and period. A lower monthly rate on a different unit isn't a saving until the annual totals match on those terms.
How Billing Terms Change the Real Price
Batch the billing question into one formula. Annual price divided by the monthly price equals the break-even month, the point where annual billing starts to pay off. Everything after that month is saving, and everything before it is prepaid commitment the buyer hasn't yet recovered.
The Break-Even Calculation
A plan at $29 per month costs $348 over twelve months when paid monthly, a figure set out in the Subscription Playbook SaaS pricing guide. If the same plan is offered at $240 billed annually in a hypothetical quote, the break-even is $240 divided by $29, which is 8.3 months. A buyer expecting to cancel, switch or cut seats before month nine loses money on the annual option despite the lower unit price.
Annual billing is the common case, not the exception. CloudZero's 2025 SaaS statistics compilation, published April 18, 2025, reported that annual plans were the most common billing period at 42%, followed by monthly plans at 36%, quarterly plans at 11%, plans shorter than one year at 9%, and one-to-two-year plans at 3%. Vendors often display a monthly equivalent for an annual plan, so the full yearly commitment has to be calculated for each option before any ranking makes sense.
The Trade-Off Behind the Discount
Monthly billing costs more across twelve months but limits the loss if the tool is dropped or seats shrink. Annual billing lowers the unit price and locks the buyer into seats that may stop being used. The discount is payment for commitment, and the buyer gives up flexibility to get it.
Buyers weighing the two structures can work through the monthly versus annual billing comparison before signing. The decision rule stays simple. Annual billing fits when expected use clearly exceeds the break-even month with a stable seat count. Monthly billing fits when the tool is unproven, headcount is changing, or a replacement is already under evaluation.
Hidden Costs That Lift the Total Cost of Ownership
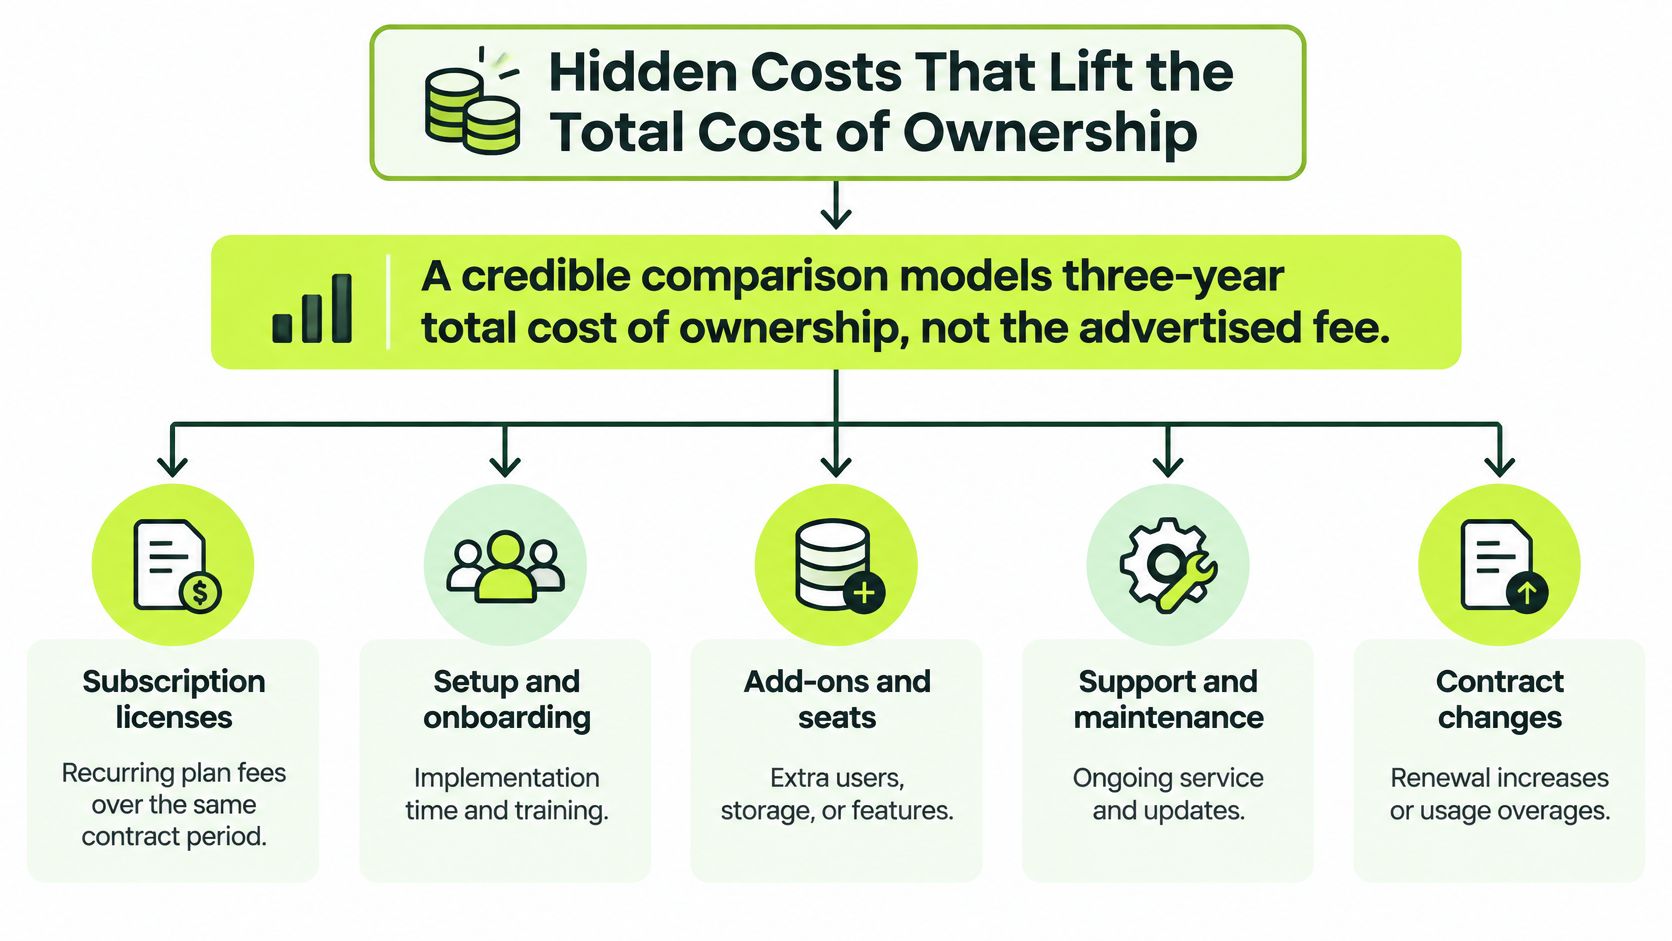
The subscription price understates what a buyer ends up paying. A VendorBenchmark analysis of more than 1,800 enterprise SaaS deployments found that implementation, professional services, customization, integrations, training, storage, API consumption, add-on modules, support, and usage true-ups can raise total cost of ownership (TCO) by 28% to 55% above the headline subscription price. Applied to a tool quoted at $100 per month, that range means the total bill lands between $128 and $155 per month once those items are priced in. On that evidence, the subscription is the starting line, and the budget has to be set higher.
The Components to Add
The model is one line per item, normalized over the same contract period. Subscription licenses, implementation, migration, integrations, support, training, usage-based charges and renewal increases all belong in the same three-year total. Omitting any one of them flatters vendors that shift cost out of the subscription and into services or add-ons.
Renewal exposure needs its own line. Nearly half of organizations reported that licensing and subscription renewal or new-contract costs increased by more than the 10% industry average, according to a 2025 West Monroe survey of 310 executives. Separately, Blue Ridge Partners' November 2024 survey of 118 executives reported that U.S. and U.K. software companies expected average price increases of 9% to 10% in 2025, while European software companies expected an average increase of 5%. A comparison built on year-one pricing misses this entirely, because the renewal increase compounds in years two and three.
Hidden cost components and their typical size
| Cost item | Typical size | Source |
|---|---|---|
| Total cost above the headline subscription | 28% to 55% higher | VendorBenchmark analysis of more than 1,800 enterprise SaaS deployments |
| Integrations | $105 to $335 per user per year | VendorBenchmark analysis of more than 1,800 enterprise SaaS deployments |
| Professional services | 1.5 to 2.5 times the first-year subscription | VendorBenchmark analysis of more than 1,800 enterprise SaaS deployments |
| Renewal or new-contract increase | Nearly half of organizations above the 10% industry average | West Monroe survey of 310 executives, 2025 |
| Expected vendor list price rise, US and UK software companies | 9% to 10% average for 2025 | Blue Ridge Partners survey of 118 executives, November 2024 |
| Expected vendor list price rise, European software companies | 5% average for 2025 | Blue Ridge Partners survey of 118 executives, November 2024 |
Training, support, storage and add-on modules carry no typical range in the benchmark, so those items should be quoted by the vendor rather than guessed. The practical step is to build one line per component, add them across three years, and compare those totals. A plan that is cheapest in year one can rank last by year three once services and renewals are priced in.
Discounts by Contract Size and Seat Minimums
Many buyers assume an enterprise discount applies to a small team. The benchmark evidence says it usually doesn't. Discount depth follows contract size and term, and a small buyer negotiating as if a large-buyer rate is available starts from a false number.
VendorBenchmark reported in 2026 that deals below 50 seats typically receive 0% to 10% off list price, mid-market contracts covering 200 to 1,000 seats typically receive 15% to 30% off, and enterprise contracts above 5,000 seats with multi-year commitments commonly reach 35% to 55% off. Those figures describe SaaS contracts signed between 2022 and 2025. They're a benchmark, not a guaranteed vendor policy.
Typical discounts off list price by contract size
| Contract size | Typical discount off list | Condition |
|---|---|---|
| Under 50 seats | 0% to 10% | Deals below 50 seats |
| 50 to 199 seats | Not published in the benchmark | No band stated, quote required |
| 200 to 1,000 seats | 15% to 30% | Mid-market contract |
| Above 5,000 seats | 35% to 55% | Multi-year commitment |
A Three Step Discount Check
- Multiply list price by required seats: That full-price total is the baseline every scenario is measured against.
- Apply the discount band as a separate scenario: The negotiated figure stays a scenario until it's signed, so it shouldn't replace the baseline in the comparison.
- Weigh the multi-year saving against seat risk: A deeper discount tied to a longer term costs money if seats become unnecessary before the term ends.
The gap between bands is wide enough to change rankings. A tool that's more expensive at list can become cheaper at 300 seats if its discount is deeper, while the same logic doesn't help a 20-seat buyer at all. Seat minimums cut the other way, because a required minimum above actual need adds paid seats before any discount applies.
A negotiated price isn't comparable until the minimum seat count, the term and the discount are in writing on the same document. Verbal discount talk has no place in a price table.
Idle Seats and Usage Fees That Inflate the Bill
Unused licenses are a direct cost, not an administrative tidiness issue. Zylo data reported by Mi3 on January 17, 2025 found that 52.7% of purchased SaaS licenses sat idle, with the surveyed organisations wasting an average of $21 million per year. The same report put average annual unused-license waste at $127.3 million across the businesses covered, up slightly from $126.9 million in 2023. Those are different aggregates, one an average per surveyed organisation and one across the businesses covered, and they shouldn't be added together.
Pricing Active Seats Instead of Purchased Seats
- Check the billing basis: Named users, purchased seats or actual usage, because each one treats inactivity differently.
- Pull login data for the last 30 days: Provisioned accounts that never sign in are the first candidates for removal.
- Divide the annual total by active users: That quotient is the per-user price the organization pays.
A worked example shows the gap. Ten seats at $29 per month cost $290 per month. If only six people use the tool, the cost per active user is $48.33 per month, not $29. Ranked at $29, the tool looks cheaper than a $40 per account alternative. Ranked at $48.33 per active user, it doesn't.
Usage fees inflate bills by a different route. Metered and flat-tier plans charge overage once volume passes the included allowance, so the buyer should price the tool at twice current volume before signing. Readers comparing consumption structures can check the AI pricing models guide for how metered charges are packaged. Seat cuts and usage caps need to happen before renewal, because the renewal date converts unused capacity into another fixed term of cost.
Which Price Structure Fits Your Buyer Type
Buyer size decides which check matters first. Four common situations show how the same method produces different first questions.
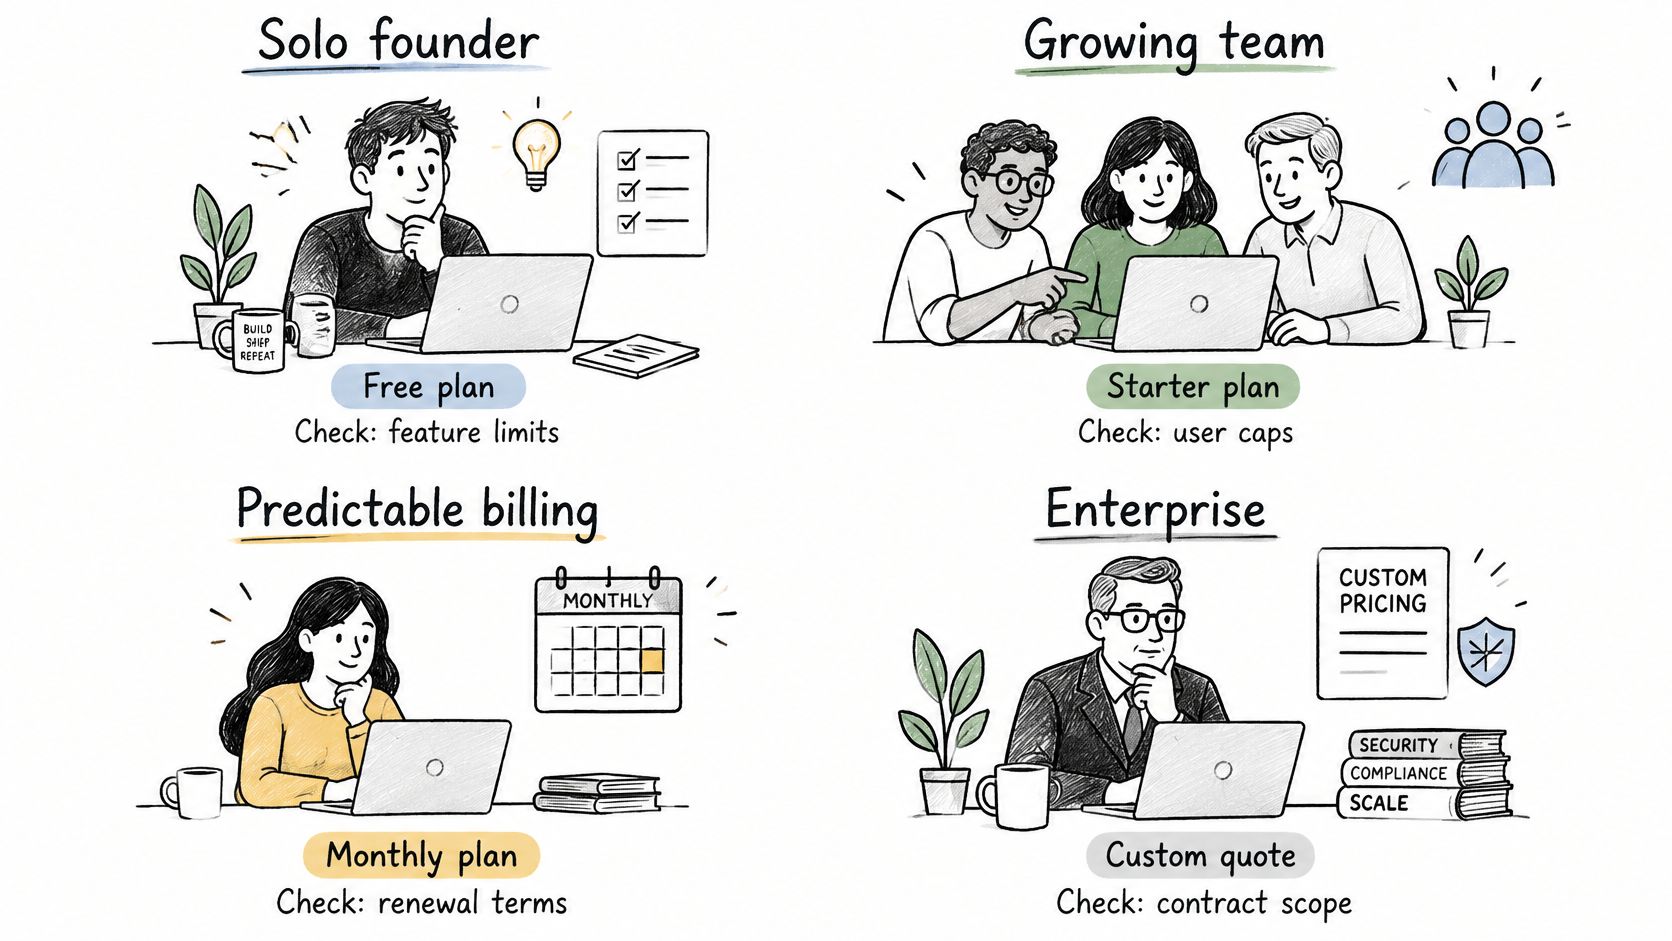
Solo founder with a few tools. Free plans are the cheapest workable starting point. In Rankozo's indexes, 71% of AI tools and 58% of marketing and SEO tools offer a permanent free plan. The first check is whether a paid feature is needed, and monthly billing fits until it is. JPMorgan Chase Institute data shows median monthly AI spending across small businesses declined from about $80 in 2022 to roughly $30 in 2025, while newer adopters entered at about $20 per month versus roughly $50 for businesses adopting in 2019 or 2021, a 60% reduction in entry cost. Lower entry prices encourage tool proliferation, so each added tool still needs an active-user count.
Team running email marketing. The structure is usually per-contact or tiered by list size. In Rankozo's Marketing and SEO price index, the median starting price is $19 per month, 58% of tools have a free plan, and the cheapest paid tier is Brevo at $9 per month. The first check is the contact count at that tier's limit, because the price steps up when the list outgrows it.
Ten-person team tracking time. Per-seat pricing applies. In Rankozo's HR and work price index, the median starting price is $9 per month, 33% of tools have a free plan, and the cheapest paid tier is Clockify at $3.99 per seat per month. Ten seats at that rate cost $478.80 a year. The first check is whether all ten people log time, since idle seats raise the per-user cost directly.
Mid-size company buying at scale. Volume changes the negotiation rather than the list price. A buyer in the mid-market band should model the discounted scenario separately from list and confirm the minimum seat count and contract term before ranking vendors. The first check is whether the required minimum exceeds realistic active use, because overbought seats can erase the discount.
Confirm the Lowest Real Cost Before You Buy
Start from the paid price, not the advertised one. Four final checks close the gaps that category medians and list prices leave open.
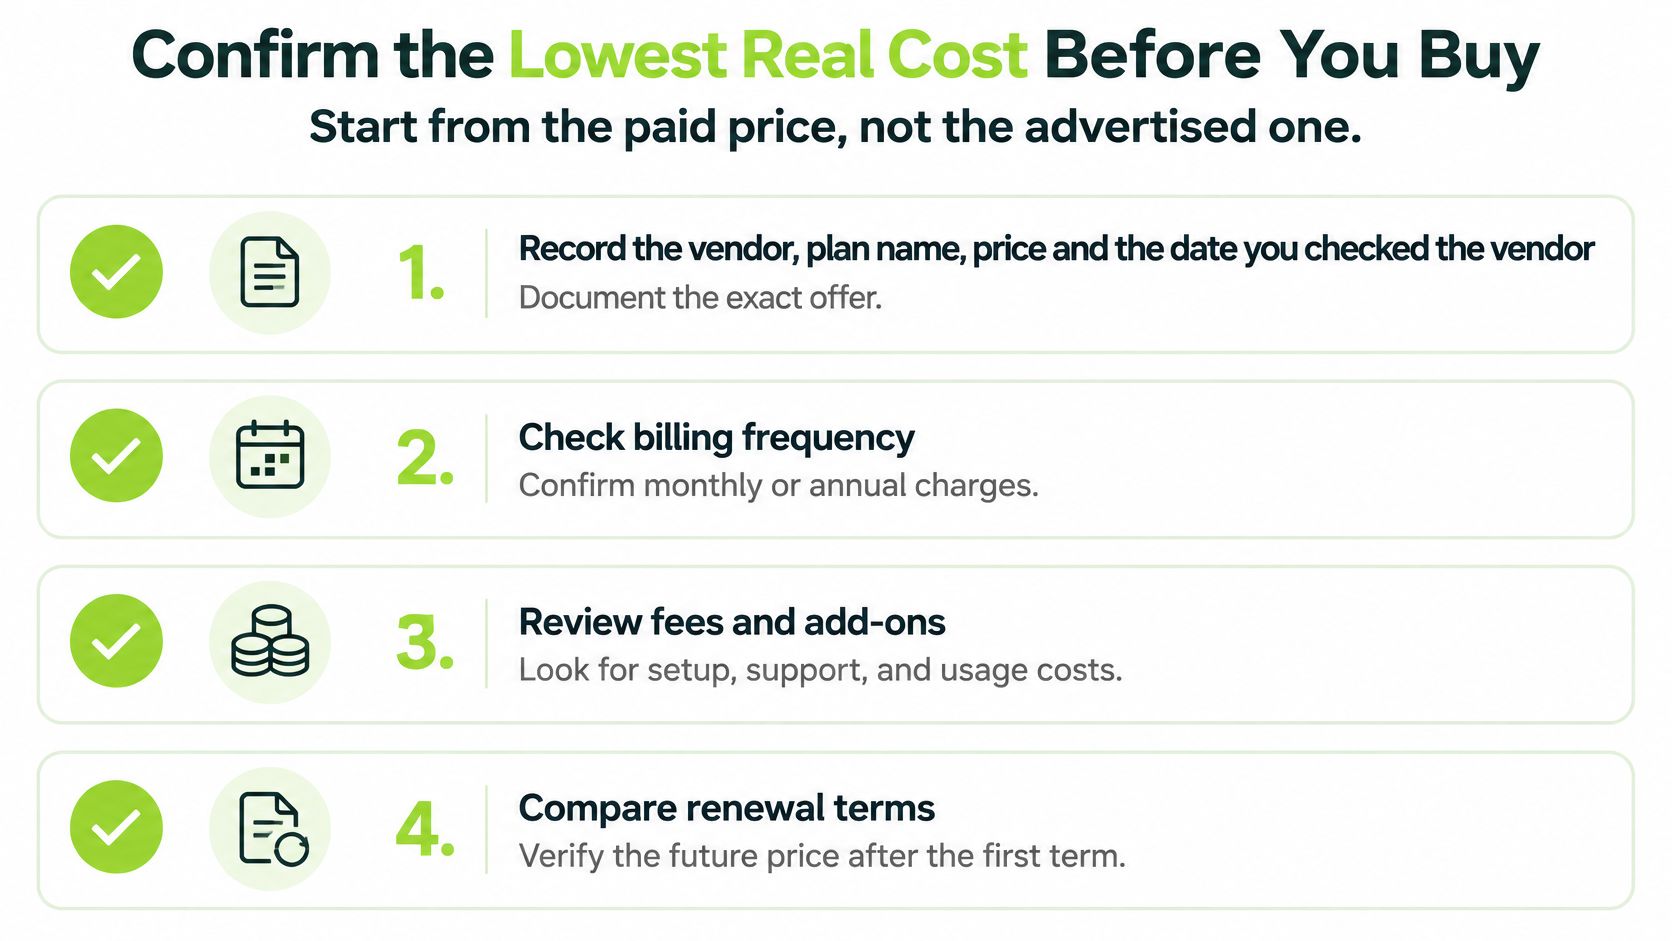
- Record the audit trail: Vendor, plan name, price and the date the vendor page was checked, so the comparison can be verified later.
- Get the commercial terms in writing: Minimum seat count and the discount scenario belong in the contract, because a negotiated figure is only a scenario until it's signed.
- Model the renewal year separately: Year-two and year-three prices should carry an explicit increase assumption rather than repeating the entry rate.
- Confirm identical terms across options: The three-year total must use the same unit, team size and period for every vendor on the list.
Tools whose vendors publish no prices are listed without a starting price, with the vendor quoting each package. A quote-only product needs a written figure on the same terms before it sits beside listed prices. The option to choose is the one with the lowest three-year total that still covers the active users counted.
Run the numbers before signing. Readers can pull the category medians, cheapest paid tiers and free-plan shares from Rankozo's price indexes, annualize each quote on the same unit and seat count, add implementation and renewal lines for three years, and buy the option with the lowest all-in total rather than the lowest monthly headline.
Questions or corrections: editorial@rankozo.com