Guide · General
How Much Does Internet Cost Per Month: 2026 Price Guide
How much does internet cost per month in 2026? Typical prices by connection type, speed and location, plus the fees that raise the bill.
By the Rankozo research desk · Updated November 5, 2026 · 12 min read
The cheapest workable standard broadband package in the UK cost £30.82 per month at the promoted price in September 2025, rising to £34.99 per month at list price once the promotion ended, according to the September 2025 tracker in Ofcom's Pricing and consumer engagement report 2025. That £4.17 gap, worth £50.04 over twelve months, is the starting point for any honest answer to how much does internet cost per month, because the sign-up figure and the ongoing figure are two different numbers and the second one runs for longer.
A bill that looks routine in one market can consume a far larger share of pay in another. The International Telecommunication Union affordability report puts a fixed-broadband subscription in a low-income country at nearly one-third of average monthly income, while the entry-level fixed basket costs about 1% of monthly income in high-income economies. The sticker price alone settles nothing. What a household pays depends on the bill's share of income, the post-promotion rate, and any one-time charges stacked on top.
Table of Contents
- What Internet Costs Per Month by Connection Type
- What Pushes the Price Up
- Advertised Price Versus Your Real Monthly Bill
- What a Bill Costs Relative to Pay
- Fixed, Mobile and Satellite Fit by Use Case
- Calculate Your Real Monthly Cost and Confirm It Before You Sign
What Internet Costs Per Month by Connection Type
The 2024 global median fixed-broadband price came to 2.5% of monthly gross national income per capita, according to the International Telecommunication Union 2024 price basket report. The basket behind that figure is defined narrowly: the cheapest domestically available fixed subscription offering at least 5 GB of monthly data and an advertised download speed of at least 256 kbit/s. A median expressed as a share of income, rather than as a currency figure, is the point. Identical prices carry different weight in different markets, and an entry-level basket says nothing about what faster fiber or unlimited data costs.
For a given address, the defensible benchmark is the cheapest paid plan that works on each connection type, quoted with its market, date and unit. Anything faster, unlimited, bundled with television or supplied with rented equipment sits above that floor.
Published prices by connection type
| Connection type | Market and plan | Monthly price | Source and year | Date checked |
|---|---|---|---|---|
| Starlink residential 100 Mbps | US, select areas | $44 to $66 | Notebookcheck, 2026, citing Starlink 2026 US pricing | 2026 |
| Starlink residential 200 Mbps | US, select areas | $68 to $102 | Notebookcheck, 2026, citing Starlink 2026 US pricing | 2026 |
| Starlink Roam | US, starting price | from $55 | Starlink residential pricing page, 2026 | 2026 |
| Standard broadband, promoted price | UK | £30.82 | Ofcom Pricing and consumer engagement report, 2025 | September 2025 tracker |
| Standard broadband, list price | UK | £34.99 | Ofcom Pricing and consumer engagement report, 2025 | September 2025 tracker |
Two rows can share a vendor and a market without describing the same product. Starlink's residential tiers run from $44 to $102 depending on speed band and area, while Roam starts at $55 for a mobile service priced on a different basis, so the lowest figure on the page cannot stand in for a fixed home connection. The same unit discipline applies across the whole table: starting price means the cheapest paid plan, per user where the vendor prices per user, and a figure is comparable only with another figure in the same unit. A promoted price and a list price are different units too.
The UK pair shows why that distinction matters in practice: £34.99 against £30.82 is a £4.17 monthly gap between the advertised figure and the standard rate, and the standard rate is what a household pays for most of its time on the contract. None of the rows includes taxes, equipment rental or installation either, so each figure in the table is a floor for the connection type it names rather than a prediction of the bill.
What Pushes the Price Up
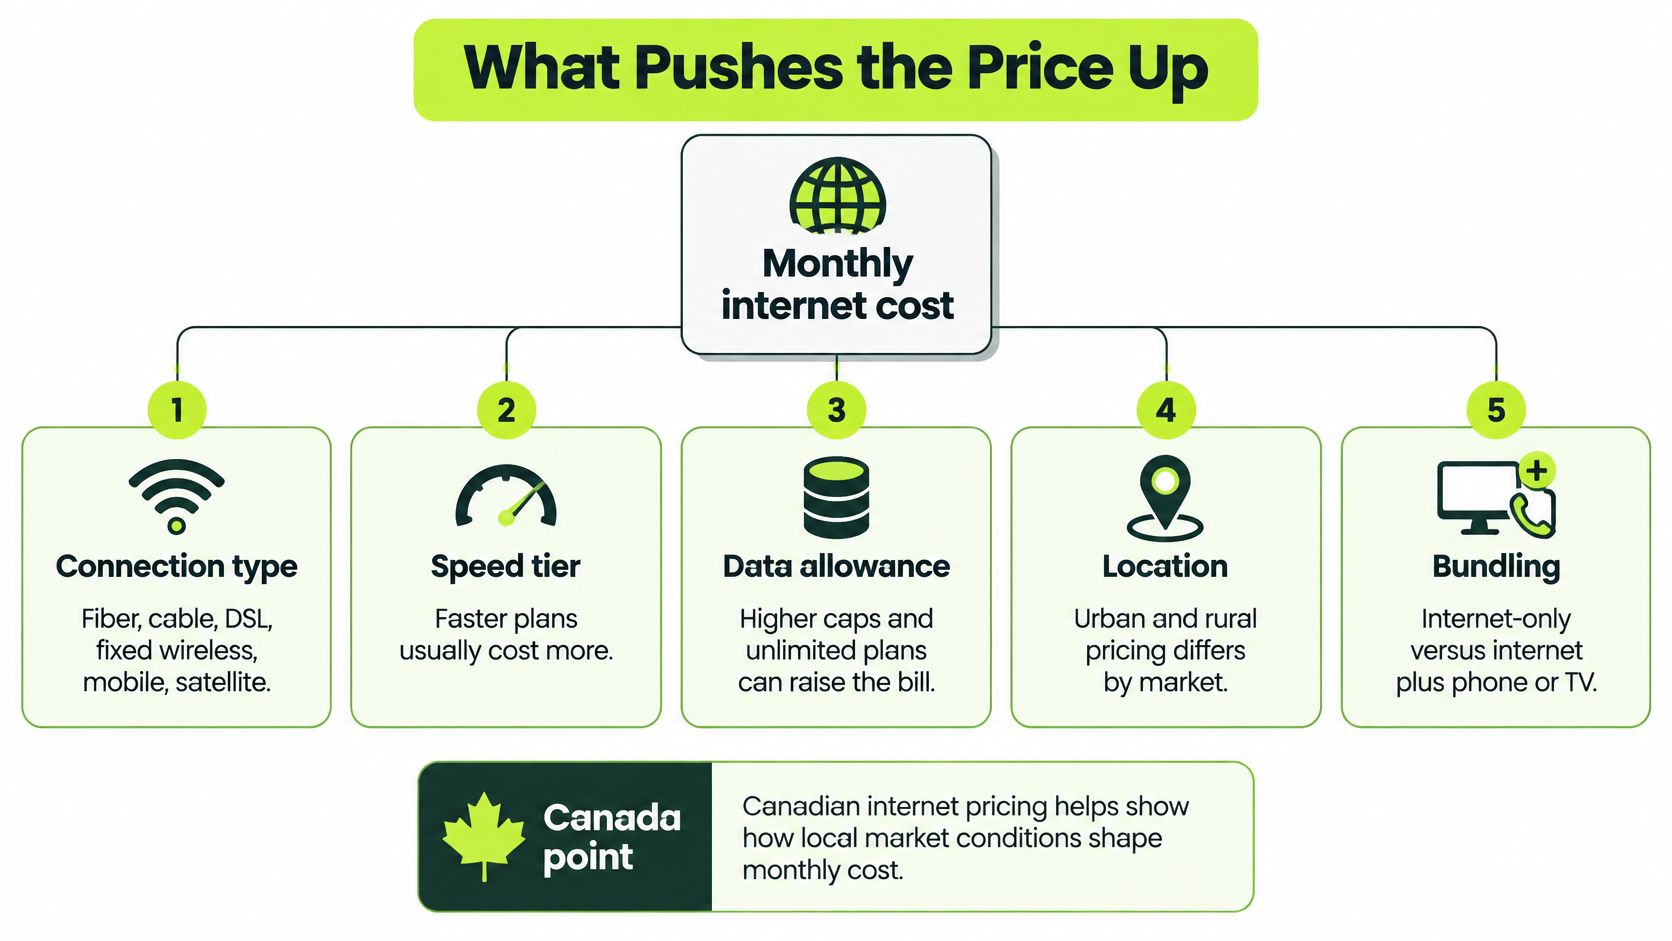
Five factors move the monthly figure, and they don't carry equal weight for every household. Connection type sets the network a provider must build and maintain to reach an address. Speed tier then sets the capacity bought on that network, and data allowance sets how much use the monthly fee covers before extra charges or limits apply.
Speed tier and data allowance
Speed tiers can move in opposite directions in the same market. The CRTC Canadian Telecommunications Market Report 2025 reports that prices for plans offering gigabit speeds or faster decreased, while prices for unlimited 50/10 Mbps plans increased. A national average therefore conceals which tier a household is buying, and a low advertised price for a slower tier can't stand in for gigabit service.
A capped plan works the same way in reverse. A lower headline fee stops being cheaper once usage passes the allowance and overage charges apply, so the plan should be priced at expected monthly use rather than the allowance printed in the offer. Households that stream television every evening should count that viewing as part of the same monthly budget, and Rankozo's streaming price statistics page puts those subscription costs alongside the connection that carries them.
Location and bundling
Location decides which plans exist at an address at all. Starlink's residential 100 Mbps and 200 Mbps plans are available only in select areas, so the same provider can sell one household a tier that a household elsewhere can't order. Bundling lowers the headline internet price only when the household uses the phone or television service included. An unused add-on is a higher bill, not a discount.
Match the speed tier to the number of people and devices online at peak hours, then price the tier directly below and directly above it before deciding.
The lowest monthly price isn't always the lowest cost of working internet. A tier that's too slow at peak hours, or an allowance too small for normal use, forces an upgrade or extra charges later. The household then pays more per month than the mid-range plan it passed on, and the saving exists only on the first few bills.
Advertised Price Versus Your Real Monthly Bill
The sign-up figure is often a promoted tariff with an end date. The Ofcom Pricing and consumer engagement report 2025, using the UK Monthly Broadband Pricing Tracker for September 2025, puts promoted standard broadband at £30.82 per month against a list price of £34.99, a £4.17 monthly gap between the introductory offer and the regular rate. Both the promoted price and the list price fell 4% year over year, so the gap isn't a one-off artefact of rising list prices.
One-time charges widen the difference in the first month. Installation, setup and activation fees can vary considerably by provider, so a first bill can exceed the quoted monthly price even when the recurring fee is stated correctly. Equipment rental, taxes, mandatory surcharges and early-termination fees sit outside the advertised figure as well.
Effective monthly cost over 12 and 24 months
| Scenario | Monthly fee | One-time charges | 12-month total | 24-month total |
|---|---|---|---|---|
| Promotional rate, term ends after 12 months | Promoted rate stated in contract | Amount stated in provider terms, counted once | Monthly fee × 12, plus one-time charges | First 12 months at promoted rate, next 12 at regular rate, plus one-time charges |
| UK standard broadband, promoted then list (Ofcom, September 2025) | £30.82 then £34.99 | Amount stated in provider terms, counted once | £369.84 at £30.82 × 12, before one-time charges | £789.72 for 12 months at each rate, before one-time charges |
| Router rented from provider | Plan fee plus monthly rental stated in terms | Installation or activation stated in terms | Combined monthly fee × 12, plus one-time charges | Combined monthly fee × 24, plus one-time charges |
| Router bought outright | Plan fee with no rental line | Purchase price paid once | Plan fee × 12, plus purchase price | Plan fee × 24, plus purchase price |
| No contract, month to month | Monthly rate stated for no-contract terms | Activation stated in terms, with no early-termination fee in the scenario | Monthly fee × 12, plus activation | Monthly fee × 24, plus activation |
Buying a router outright moves cost from the monthly column into the one-time column. The break-even point is the purchase price divided by the monthly rental it replaces, and buying only pays off if the household keeps the service past that month.
The 24-month average is the figure to compare across providers, because it absorbs the promotion, the regular rate and the one-time charges into one monthly number.
What a Bill Costs Relative to Pay
A nominal price says nothing about whether a household can carry it. The World Bank report summarizing ITU affordability data identifies broadband as affordable when it costs no more than 5% of average monthly income, and it gives two contrasting cases. In Denmark, fixed broadband priced at $44 per month was affordable under that threshold for the entire population, while in South Africa a $27 monthly fixed-broadband price was affordable for only 30% of the population.
The cheaper bill is the heavier burden in that pairing. Income distribution, not the sticker price, decides who can subscribe, which is why a global or national average price is a weak budgeting tool for an individual household. Rankozo's household budget statistics page is the place to set a connection bill against other recurring household costs rather than judging it in isolation.
The income rule behind the thresholds
The arithmetic is direct. For a bill to stay within 5% of monthly income, required income equals the bill multiplied by 20. For the stricter 2% affordability benchmark used for entry-level broadband, required income equals the bill multiplied by 50.
| Monthly bill | Income needed for 5 percent threshold | Income needed for 2 percent benchmark |
|---|---|---|
| $30 | $600 | $1,500 |
| $50 | $1,000 | $2,500 |
| $70 | $1,400 | $3,500 |
| $100 | $2,000 | $5,000 |
| $150 | $3,000 | $7,500 |
Read the table by finding the monthly bill, then comparing the income column with actual household income. A bill that needs more income than the household has is above the threshold, whatever the advertised price looks like next to rival offers.
The income gap between markets is wide enough to change the conclusion entirely. The ITU 2025 affordability of ICT services report states that lower-middle-income economies spent about seven times as much of their income on mobile broadband as high-income economies, and low-income economies spent about 22 times as much. Falling nominal prices therefore don't prove that access is broadly affordable.
One caution applies to headline medians. ITU publications don't all report the same global fixed-broadband median for the same year, so any median should be cited to its specific ITU report and year rather than treated as a single settled figure.
The 5% threshold is a benchmark for judging burden, not a legal limit on what a provider may charge.
Fixed, Mobile and Satellite Fit by Use Case
Pick the connection type by the job it has to do. Fixed broadband suits heavy home use where several people need stable speeds at the same time, and it's the default for households that work, stream and download large files from one address. Mobile data suits light single-user needs, temporary housing and a backup line when the fixed connection fails. Satellite suits addresses that wired networks and reliable mobile coverage don't reach.

Entry-level international baskets are price floors for minimal service, so a household buying faster speeds, higher allowances or rented equipment should expect to pay more than those floors over both 12 and 24 months. Mobile service can look cheaper per month while delivering a smaller data allowance, which makes it a poor substitute for a fixed line in a home that streams daily. Readers pricing a phone-based option can set the handset cost beside the plan using Rankozo's smartphone price statistics page.
Satellite carries a different cost structure from wired service. The Starlink residential page, checked in 2026, listed a Roam starting price of $55 per month, stated that residential 100 Mbps and 200 Mbps plans were available only in select areas, and advertised free professional home installation for the displayed residential offering. A satellite quote can also carry one-time charges such as shipping and taxes on top of the monthly rate, so the first-year cost sits above twelve times the advertised figure.
- Fixed broadband: choose it for shared home use, remote work and stable peak-hour speeds.
- Mobile data: choose it for one light user, short stays or backup coverage.
- Satellite: choose it where wired and mobile service don't reach the address.
An address check on the provider's coverage page settles the choice, because a plan that isn't sold at that address has no usable price.
Calculate Your Real Monthly Cost and Confirm It Before You Sign
A workable comparison needs seven figures, recorded in order, for each provider under consideration. Skipping steps produces a lower number that isn't the bill.
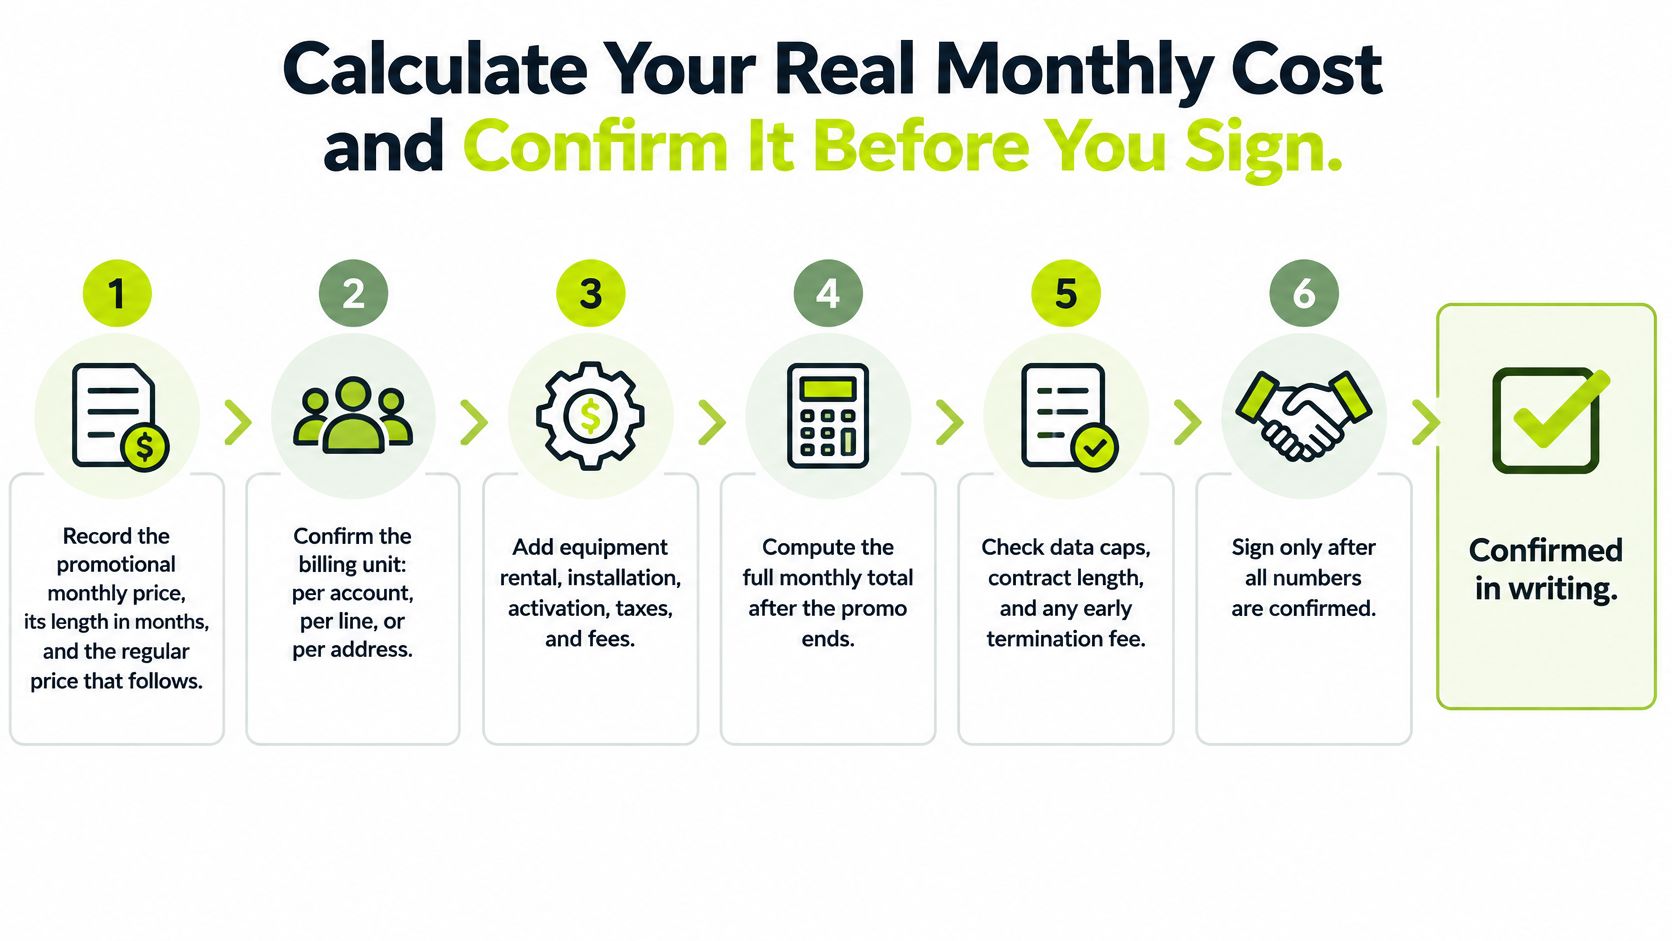
- Record the promotional price and its length. Write down the monthly promotional rate, how many months it runs and the regular price that follows it. A promotion without a recorded end date can't be priced over a contract.
- Confirm the billing unit. Establishes whether the offer is priced per account, per line or per user before any comparison starts. Vendors price in different units, so a $10 per user plan and a $10 per account plan are not the same deal.
- Add monthly equipment rental. Include modem or router rental as a recurring line, not as part of the access price, so a later decision to buy equipment changes one clear figure.
- Spread one-time charges over 24 months. Divide installation, activation and any equipment purchase by 24 to express them as a monthly amount. This step is what stops a large first bill from disappearing out of the comparison.
- Add taxes and mandatory surcharges. Take them from a sample bill or the provider's published terms rather than estimating them, because they're charged whether or not the advertisement mentions them.
- Calculate both totals. Add up the full 12-month and 24-month cost, then divide each total by its number of months to get the effective monthly cost for each period.
- Test the result against income. Compare the 24-month monthly average with household income using the 5% and 2% thresholds, so the decision reflects burden as well as price.
Checks to complete before paying
Three confirmations belong after the arithmetic and before signature. The address must be covered for the speed tier being priced, since a cheaper tier sold elsewhere can't be substituted. The early-termination fee must be known in writing, including whether it falls as the contract runs. The no-contract option must be priced on the same 24-month basis, because a higher monthly rate with no termination fee can cost less for a household that expects to move.
A promoted plan that looks cheapest in month one can cost more over 24 months than a plan with a higher sign-up price and a lower regular rate.
Write each figure down with the date it was checked. Prices are quoted from vendor pages on the date shown and change often, so an undated figure can't be verified later when the bill arrives.
The most common slip is completing only step one. That understates the cost by the one-time charges, the equipment rental and the increase that lands when the promotion ends, which are exactly the amounts that separate one provider from another over two years.
Shortlist the two providers whose 24-month averages fit the budget, confirm coverage at the address for both, then sign for the lower 24-month total.
Price your own shortlist before the next renewal date. Take two providers that serve the address, run both through the seven steps, record every figure with its check date, and sign only for the lower 24-month total. Readers comparing other recurring costs can use Rankozo's price indexes and cost guides at Rankozo to apply the same dated, source-linked method across software, subscriptions and household spending.
Questions or corrections: editorial@rankozo.com